AI TOOL / #05428
Genkin
An AI-powered tool for effortless financial tracking and analysis.
Introduction
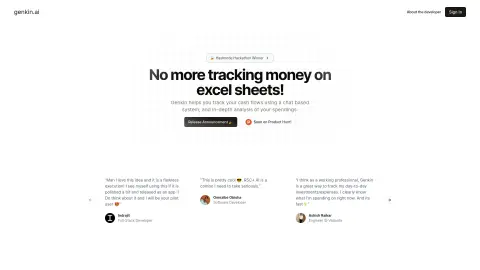
AI-powered tool for effortless money tracking and financial analysis.
What is Genkin?
Genkin is an AI-powered financial tracking tool designed to help users easily understand their spending habits and manage cash flow. It uses a chat-based system for entering transactions and provides in-depth analysis through clear, interactive charts. Genkin aims to replace traditional financial tracking methods such as Excel spreadsheets with a modern, AI-driven approach to personal finance.
How do you use Genkin?
Users can interact with Genkin as naturally as chatting with a friend to log everyday transactions. For example, a user can simply tell Genkin: “Hey Genkin, I bought a pair of glasses for $50.” The AI system processes these inputs and provides financial insights and analysis.
Genkin's core features
AI-powered trade entry through a chat-based system
Clear, interactive charts for understanding spending habits
Conduct an in-depth analysis of cash flow and expenditures.
Have full control over filtering and sorting financial data.
Leveraging Gemini 1.5 Flash technology to enable fast responses.
Clear, interactive charts for understanding spending habits
Conduct an in-depth analysis of cash flow and expenditures.
Have full control over filtering and sorting financial data.
Leveraging Gemini 1.5 Flash technology to enable fast responses.
Related
GenPPT – AI PowerPoint Generator
An AI-powered presentation tool that allows you to create PowerPoint presentations quickly and easily.
CarBeast
An AI assistant that assists with decisions regarding car ownership, maintenance, and repairs.
Iara Chat
The Multi-Channel Artificial Intelligence Center provides pre-trained artificial intelligence models to enhance productivity.
New Specsight
Translating code changes into product updates
Hyperresearch
In-depth research tool for citation checking
Graphy for Data Storytelling
Graphy enables the creation of simple, fast, and visually appealing charts, thus simplifying the process of presenting data.